Forecasting Weather (Part 1): Ideas & Looking At The Data
2025-04-10
Table of Contents
Introduction:
Ever wonder why the weather app says there's heavy rain today, while you're sitting under the burning sun? Me too.
Apparently it's not as easy as one might imagine, what we have today is borderline magic.
But still curiosity got the better of me, so I decided to start this project, to uncover what makes it so challenging and maybe learn something along the way.
But How Does Weather Even Work?
I remember the weather related chapters used to be some of the most interesting chapters in geography, back in school. Even more so than the science classes (I'm a science student). It was one of those chapters that just made pure logical sense, without overwhelming the students with math.
To better understand the numerical observations, we must first qualitatively understand what weather patterns on Earth actually look like. This part will try to cover as much as possible in a reasonable amount of time. (excuse the use of non-technical terms, it's meant to give an idea without getting into the jargon)
The Basic Mechanics:
Convection:
Okay so this is typically common-knowledge, but as a refresher, hot-air is typically lighter (less dense) than cold-air. This causes hot air to rise up into the atmosphere, causing a Vertical wind current.
Drop In Temperature with Height:
The temperature usually drops at the Normal lapse rate (i.e 6.5 °C every 1km).
One might deem this as common sense, however, the reason is more nuanced than you might think. The atmosphere actually cannot absorb incoming energy from the sun, the heat supply actually comes from the earth (as it is radiated back into the atmosphere). The main reason has to do with long and short waves (terrestrial & solar radiation), but it would require a lot more context to explain. With this highly simplified line of thinking, one can easily imagine the drop in temperature as we get farther away from the surface.
Drop In Pressure with Height:
Again this is due to the effects of gravity on air. (treating it as a collection of particles).
Pressure Differences Drive Wind:
Air always moves from high pressure to low pressure. Now this pressure difference may be caused in a number of ways, like, temperature differences causing hot air to rise, and leaving behind an area of low pressure, or high relative humidity, etc.
Water Heats/Cools Faster than Land:
This gives rise to daily effects like, land breeze & sea breeze (due to temperature differences), as well as yearly effects as we will see ahead.
Advanced Mechanics:
The Pressure Belts:
There are four kinds of pressure belts on earth:
- Equitorial LOW pressure belt (ITCZ).
- Subtropical HIGH pressure belt.
- Subpolar LOW pressure belt.
- polar HIGH pressure belt.
This image explains it much better than words can:
In essence however, hot air rises at the equator, and cold air descends at the tropics. Same for subpolar and polar, however this time its more to do with the rotation of the earth driving it. (Explaining the whole mechanism will take too much time for a refresher).
I would also like to bring your attention to the names of these winds, and their direction, it will be important later.
Ocean Currents:
There are many so look at this figure instead:

Especially pay attention to the Peruvian current. It is infact not a permanent current, it's appearance marks El Nino which will be explored ahead.
Rain Shadow & Returning Monsoons:
Topological protrusions like mountains can cause significant changes to the local weather. It may block the incoming rain and cause heavy precipitation on the Windward side, leaving the other side in Rain shadow. Rain shadow looks something like this:

Since we will be doing a lot of heatmap-type graphs later here is a more technical version. (shamelessly copy-pasted, you can read the actual paper linked with it).

Returning Monsoons is a more Indian sub-continent specific term. When the monsoon hit the himalayas, they are blocked and unable to pass (again excuse the use of non-technical and inaccurate language), and as the sun slowly moves downward the pressure belts start shifting, and the low pressure zone over the northern plains gets depleted. This causes the monsoon winds to blow backwards making it seem like they are "retreating".
El Nino and La Nina:
El Nino and La Nina are phases of the El Nino-Southern Oscillation (ENSO), driven by shifts in sea surface temperatures and atmospheric pressure across the tropical Pacific. These phases influence global weather patterns, notably the Indian monsoon, by altering wind and moisture flows. The Peruvian (Humboldt) Current, a cold ocean current off South America's coast, plays a key role in these dynamics.
El Nino Effects
During El Nino, weakened trade winds reduce the westward push of warm water, allowing it to flow back toward South America. This warms the eastern Pacific and suppresses the Peruvian Current's cold upwelling, disrupting nutrient-rich waters. For India, this often weakens the monsoon circulation, leading to below-average rainfall and potential droughts, as the usual low-pressure system over the subcontinent loses strength.
La Nina Effects
In La Nina, stronger trade winds drive warm water toward Asia, intensifying the Peruvian Current's cold upwelling along South America. This cools the eastern Pacific, enhancing atmospheric stability there. For India, La Nina strengthens monsoon winds, increasing moisture inflow from the Indian Ocean, often resulting in above-average rainfall, though excessive rain can cause flooding in vulnerable areas.
The Old Way (NWP):
We will be exploring this in later posts so it is better not to cover it here. And honestly, the wikipedia article Numerical Weather Prediction does a better job explaining this than me.
Peeking at the Data:
So after a few hours of research I stumbled upon ERA5, it's probably the best historical dataset available for free. I did consider trying to get IMD data specific to India, but I guess ERA5 is good enough for a prototype.
The dataset on its own is probably very huge (~ few Petabytes), so I decided to get only a few months and a few timestamps worth of data from 2024, i.e, Sep, Oct, Nov, Dec. And roughly 4 hour intervals.
The website conviniently provides it's api guide, as well as auto-generation of the api request.
here is the code:
import cdsapi

dataset = "reanalysis-era5-single-levels"
request = {
    "product_type": ["reanalysis"],
    "variable": [
        "10m_u_component_of_wind",
        "10m_v_component_of_wind",
        "2m_temperature",
        "mean_sea_level_pressure"
    ],
    "year": ["2024"],
    "month": ["09", "10", "11", "12"],
    "day": ["01", "02", "03", "04", "05", "06", "07", "08", "09", "10",
             "11", "12", "13", "14", "15", "16", "17", "18", "19", "20",
             "21", "22", "23", "24", "25", "26", "27", "28", "29", "30", "31"],
    "time": ["00:00", "01:00", "04:00", "08:00", "12:00", "16:00", "20:00", "23:00"],
    "data_format": "netcdf",
    "download_format": "unarchived"
}

client = cdsapi.Client()
client.retrieve(dataset, request).download()
(NOTE: apparently you're supposed to have a .cdsapirc, for authentication. But it's also supposed to be in $HOME, which makes it worse, and I spent a few hours figuring out how to have everything contained in the project folder itself (didn't work in the end))
If you didn't notice it yet, this was a really bad idea, here is why:
- I talked about weather patterns and stuff before, so it's kind of ironic, having 4 consecutive months of weather data instead of spaced out ones.
- For our use case, we wanted to Nowcast i.e predict hourly or even more fine-grained- having our original data itself be spaced by 4 hours, makes it less than ideal. We might have to either Re-download with hourly data, or interpolate locally (which seems to be a lot of work) in the future.
A few other problems exist, but those are the major problems that I might have to tackle in the future. Now, on to the fun part.
I did some searching and came across this library called cartopy (link, github), that seems to integrate seamlessly with matplotlib, and displays maps.
Here are some plots:
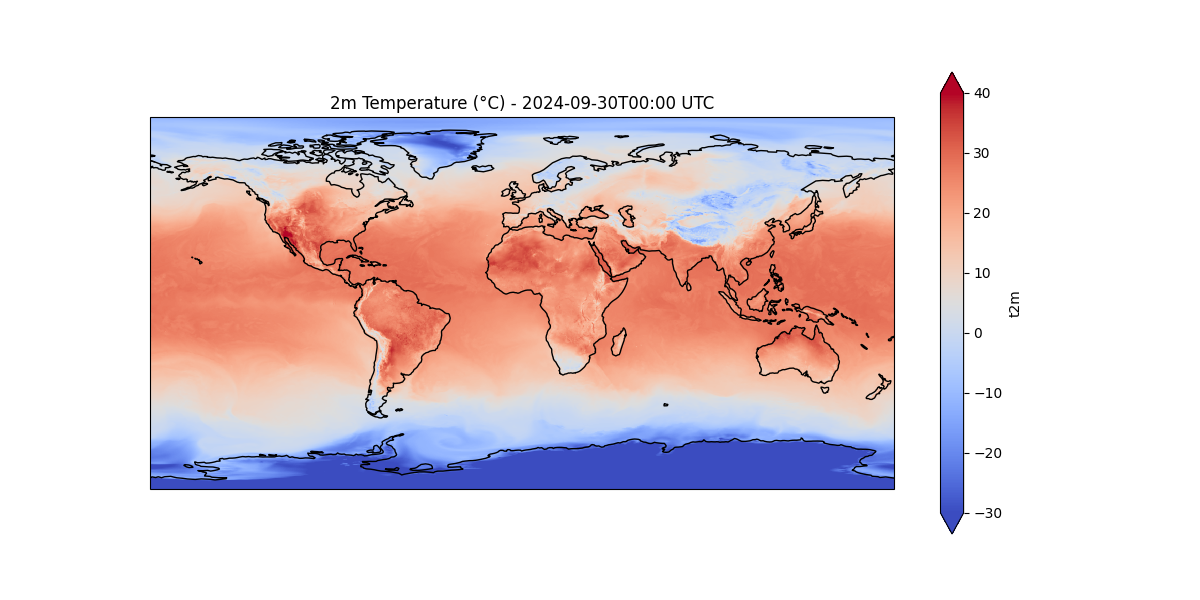

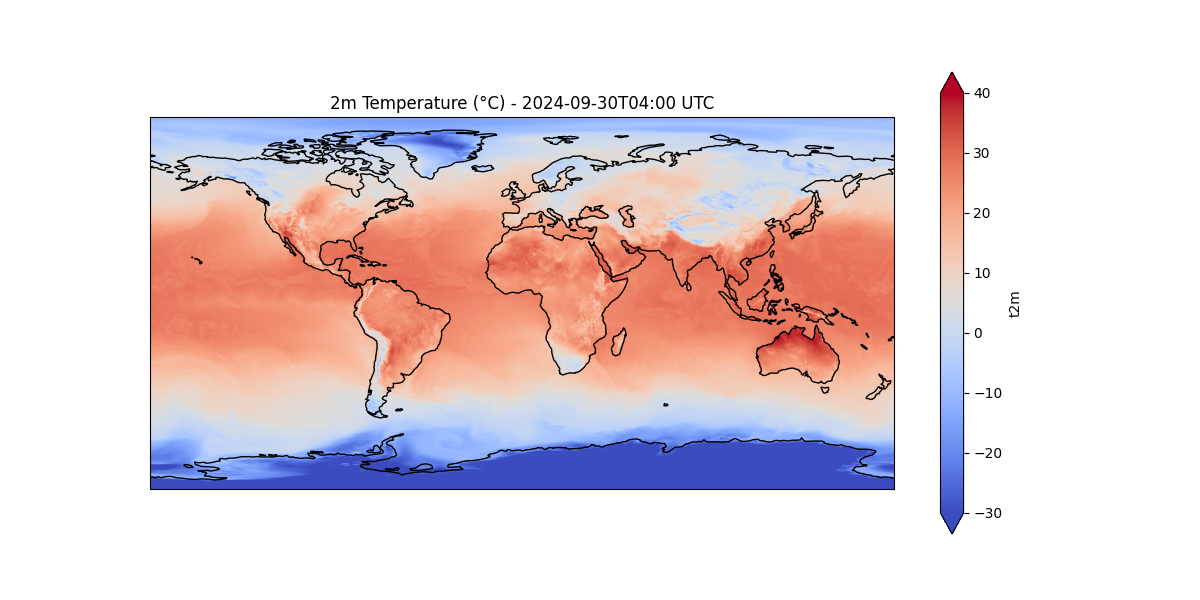
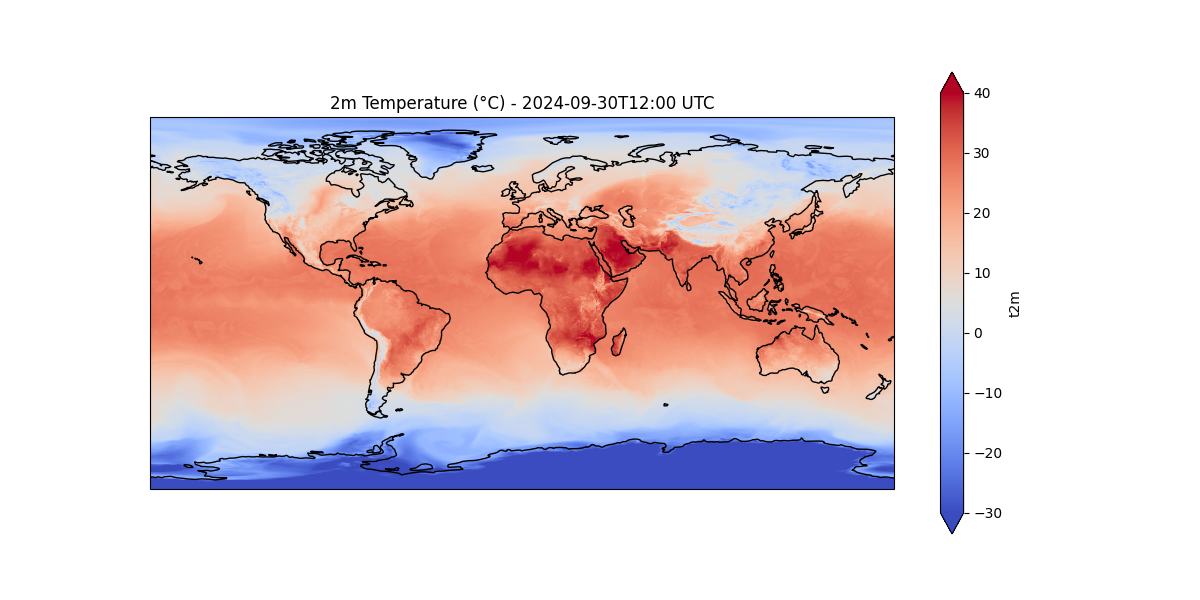
I got some initial output but It was simply a test and I've already ran into a lot of roadblocks. I am going to have to start from scratch, add total precipitation(tp), total cloud cover (tcc) and possibly switch to GRIB next time. Also have to look at the official docs, and make a project spec. See you next time.
You can read the next part here